Natural rubber
Natural rubber, 2024: from 57 t (Dominican Republic) to 4.79 Mt (Thailand), median 80.3 kt.
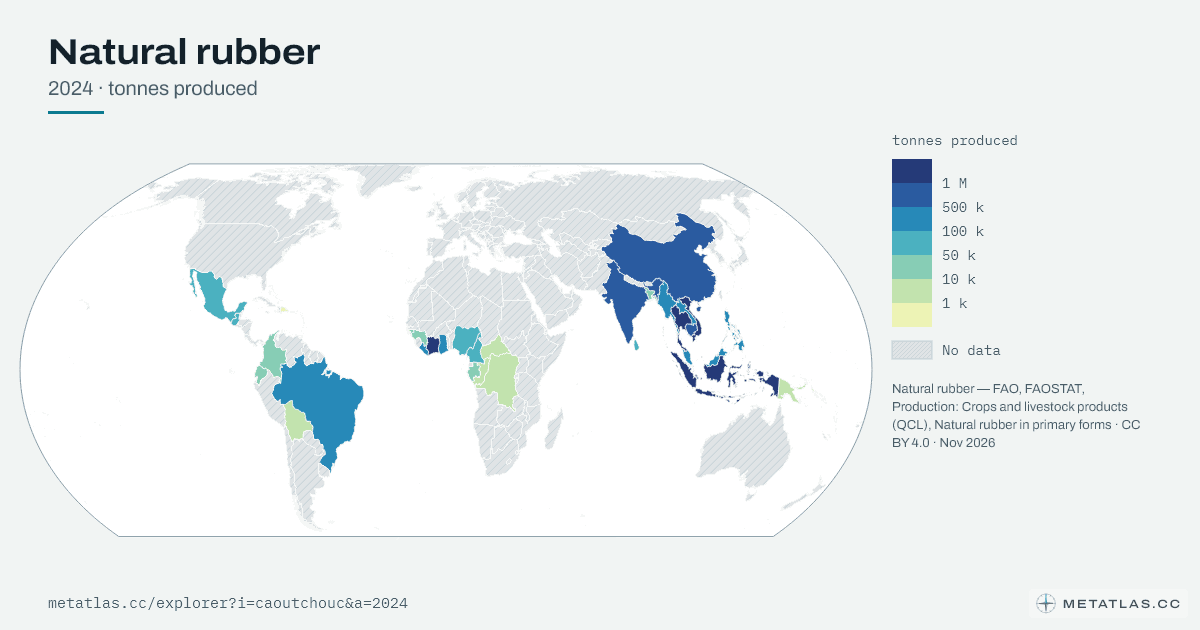
Open in the Explorer · See in the Landscapes guide
Ranking
| Rank | Country | Value (tonnes produced) | Year |
|---|---|---|---|
| 1 | Thailand | 4.79 Mt | 2024 |
| 2 | Indonesia | 2.26 Mt | 2024 |
| 3 | Ivory Coast | 1.69 Mt | 2024 |
| 4 | Vietnam | 1.33 Mt | 2024 |
| 5 | People's Republic of China | 878 kt | 2024 |
| 6 | India | 876 kt | 2024 |
| 7 | Cambodia | 527 kt | 2024 |
| 8 | Malaysia | 387 kt | 2024 |
| 9 | Philippines | 365 kt | 2024 |
| 10 | Laos | 350 kt | 2024 |
| 11 | Myanmar | 330 kt | 2024 |
| 12 | Brazil | 264 kt | 2024 |
| 13 | Ghana | 137 kt | 2024 |
| 14 | Liberia | 130 kt | 2024 |
| 15 | Guatemala | 95.8 kt | 2024 |
| 16 | Mexico | 91.4 kt | 2024 |
| 17 | Sri Lanka | 69.3 kt | 2024 |
| 18 | Nigeria | 65.3 kt | 2024 |
| 19 | Cameroon | 55.7 kt | 2024 |
| 20 | Gabon | 27.8 kt | 2024 |
| 21 | Guinea-Bissau | 25.0 kt | 2024 |
| 22 | Bangladesh | 23.0 kt | 2024 |
| 23 | Ecuador | 19.6 kt | 2024 |
| 24 | Colombia | 15.3 kt | 2024 |
| 25 | Guinea | 15.3 kt | 2024 |
| 26 | Democratic Republic of the Congo | 6.50 kt | 2024 |
| 27 | Papua New Guinea | 5.60 kt | 2024 |
| 28 | Republic of the Congo | 2.39 kt | 2024 |
| 29 | Bolivia | 1.90 kt | 2024 |
| 30 | Central African Republic | 1.20 kt | 2024 |
| 31 | Brunei | 265 t | 2024 |
| 32 | Dominican Republic | 57 t | 2024 |
Source
Natural rubber — FAO, FAOSTAT, Production: Crops and livestock products (QCL), Natural rubber in primary forms · CC BY 4.0 · Nov 2026 · www.fao.org · source updated Dec 31, 2025
Licence: CC BY 4.0